plot3D
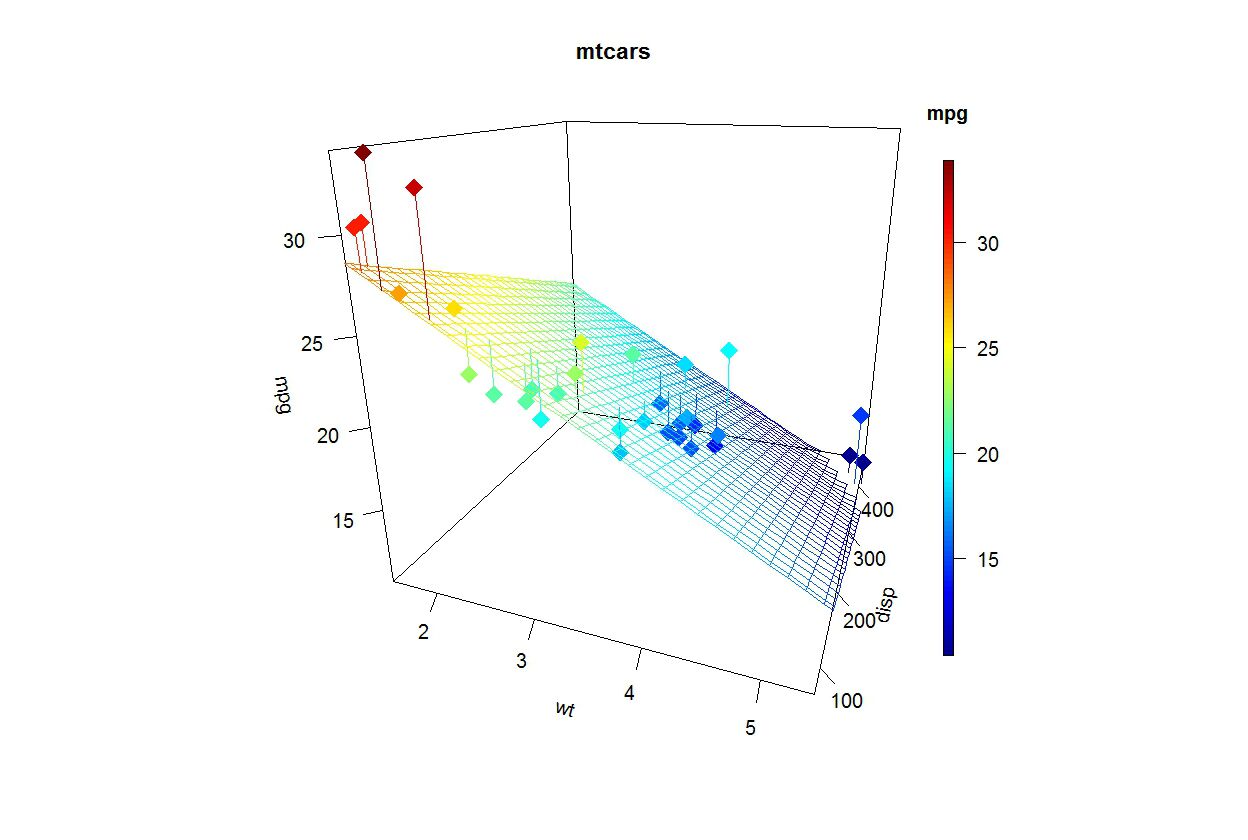
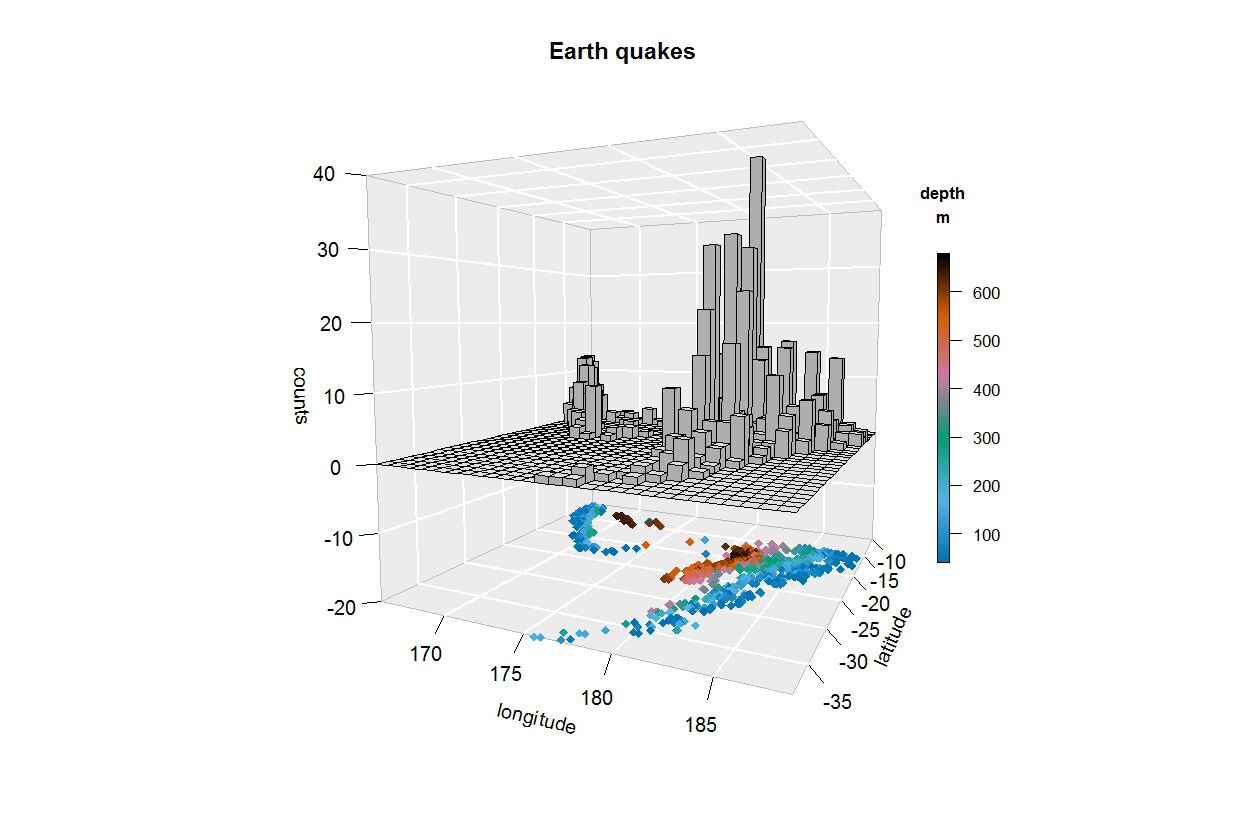
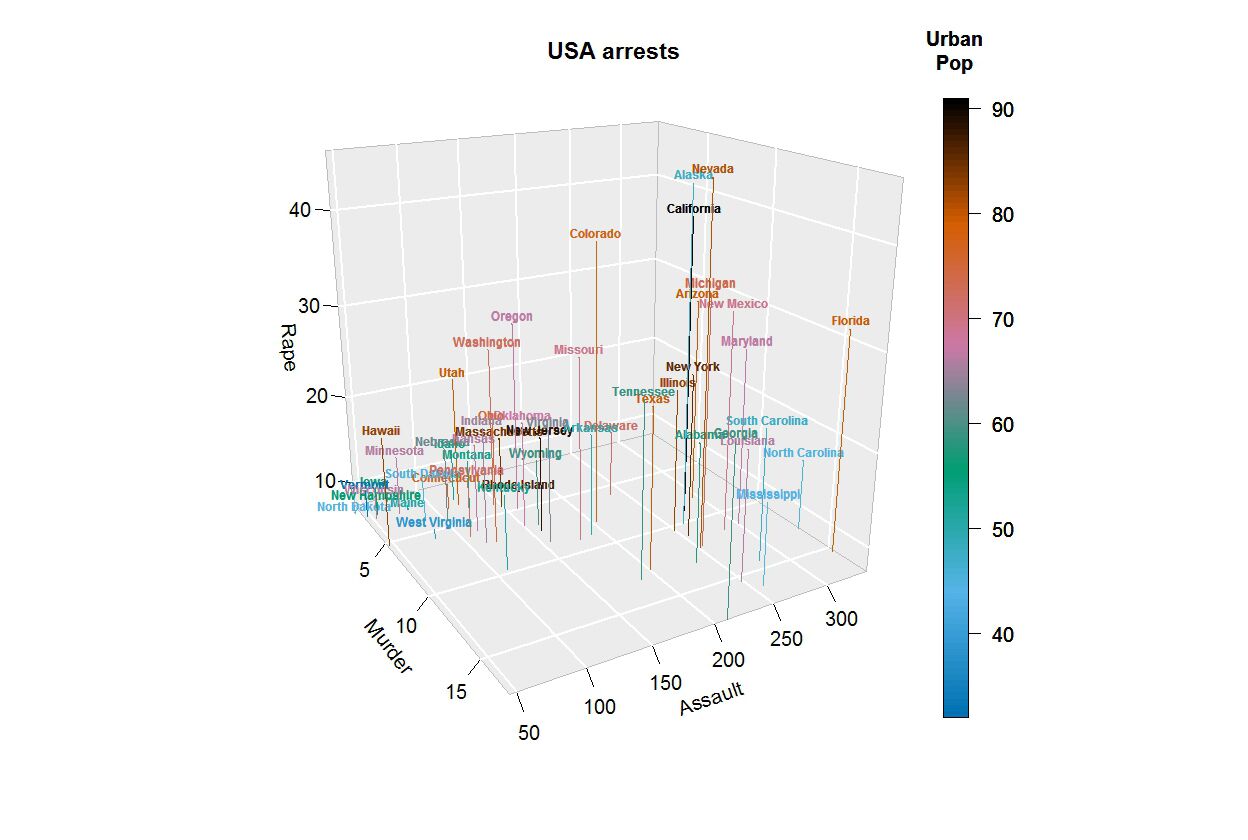
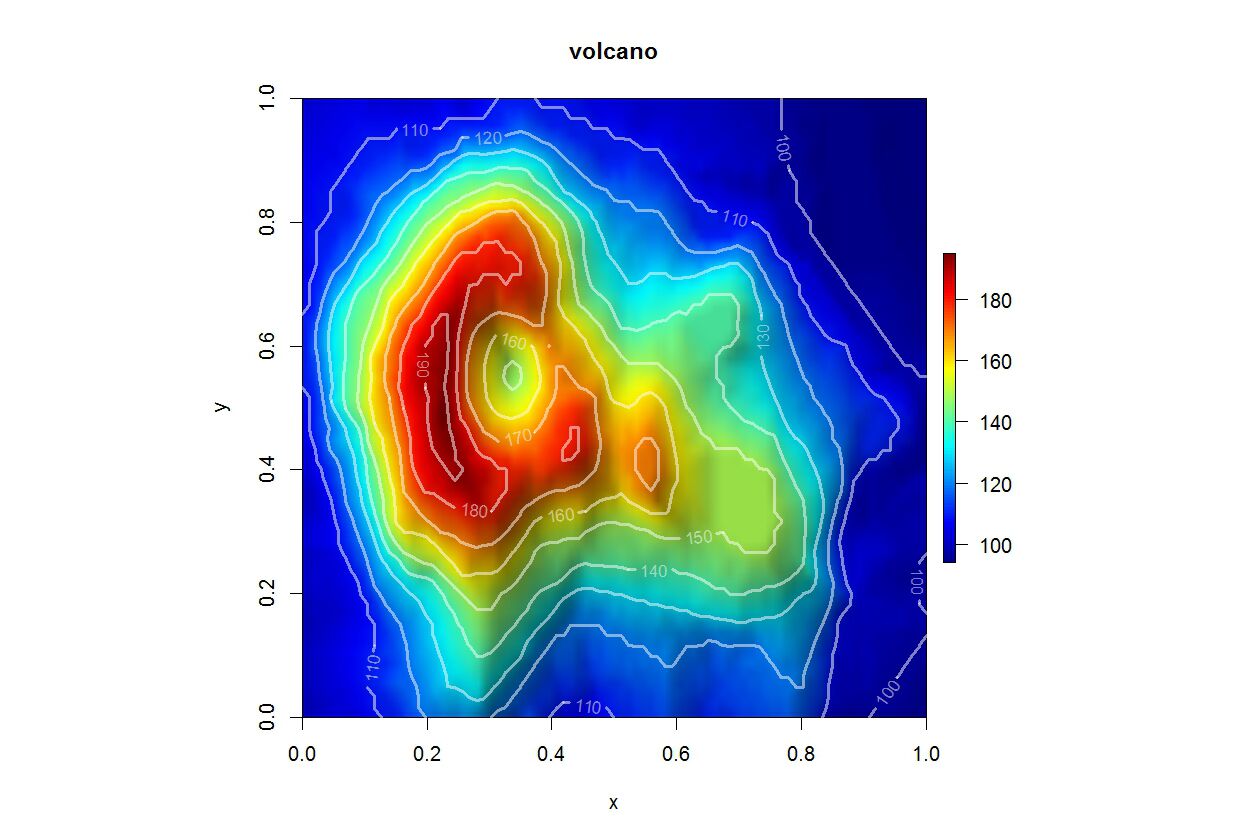
Here you will find a few examples that visualise base R datasets in a slightly different way, using the R-package plot3D created by Karline Soetaert. An accompanying package is plot3Drgl. Essentially, plot3Drgl translates the functions from plot3D to be visualised in the (superb) R-package rgl, so that figures can be rotated, zoomed, even slices cut.
Unfortunately, it is not (yet?) possible to add color keys to rgl plots, so we use plot3D to make publication-ready figures.
The packages plot3D and plot3Drgl are used in our R-package OceanView; a separate gallery shows what can be done with OceanView.